3rd Grade Mathstorms
We love MATH! :)
|
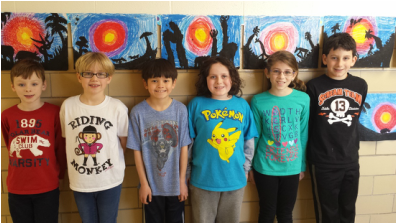
In this unit, 3rd graders tackled math challenges and puzzles, working independently and collaboratively. Combining their problem solving, computation, and geometrical skills students worked hard to meet these mathematical challenges. Throughout this unit students collected data about the topic of their choice. Students then graphed this data and drew conclusions based on their data! Check out these graphs created by the 3rd graders using Google Sheets! ENJOY! Great job Third Graders!
|
CHECK OUT THIRD GRADE DATA COLLECTION AND GRAPHS!
|
.
.
ENZO"I liked doing challenging math problems in the beginning and I liked working with partners to check."
|
MInutes Read Per NIGHTThis is a pie graph. It's comparing the temperature in Collingswood from January 6 to January 27. The most common temperature was 38 degrees Fahrenheit.
This compares the temperature in Collingswood to the temperature in Disney World from January 16 to January 27. The red is Disney World. The blue is Collingswood. This graph shows that it usually warmer in Disney World.
This graph compares the low temperature in Disney World and Collingswood from January 1 to January 15. It is usually between 20 and 30 degrees warmer in Disney World than Collingswood.
|

MICAH"I liked trying to figure out how so solve problems in different ways. It was fun to complete a challenging problem."
|
MInutes Read PER NIGHT! Micah Vs JOSIAH!This graph compares the minutes read by Josiah and Micah from January 8 to February 26. Micah is the blue line and Josiah is the red. This graph shows that I usually read for longer periods of time, but Josiah reads more often. I usually read less on the weekends.
This graph shows that from February 27 to March 18 Josiah kept reading closer to the same amount each day, while my amount of reading varied more from day to day.
|
GEREMIA"I liked learning how to problem solve with partners. Also, I learned how to figure minutes in the amount of time I slept. I also liked the logic puzzles!"
|
MINUTES SLEPT EACH NIGHTThis graph compares how many minutes I slept from January 15 to January 22. I slept the most on 22nd of January.
This graph shows how many minutes I slept from January 23 to January 29. I slept the most on the 23rd.
Click to set custom HTML
This graph compares how much I slept compared to how much Allie slept. This graphs shows Allie's minutes slept as red and my minutes slept as blue. This graph shows that Allie usually slept more.
|
"I had fun tracking how many minutes I slept every night. I liked working with partners."
|
MINUTES SLEPT EACH NIGHTThis graph shows how many minutes I slept in January. I usually slept around 600 minutes a night.
This graph compares how many minutes I slept with how many minutes Geremia slept. The red shows how many minutes Geremia slept and the blue shows how many minutes I slept. Geremia slept more.
This graph shows how many minutes I slept from the beginning of February to the beginning of March. It shows that I slept more in February.
|

WESLEY"I liked working with partners and I since I've done this I learned to be more responsible because I had to check the temperature everyday!"
|
TEMPERATURE IN COLLINGSWOOD VS LAKE PLACID!This graph shows the temperature in Lake Placid and Collingswood. The blue is Collingswood and the yellow is Lake Placid. It is usually colder in Lake Placid.
This line graph shows the temperature in Lake Placid and Collingswood. The blue is Collingswood and the red is Lake Placid. It is usually about 5-20 degrees colder in Lake Placid.
This graph shows the temperature in Lake Placid and Collingswood. The blue is Collingswood and the green is Lake Placid. It is usually colder in Lake Placid.
This graph shows the temperature in Lake Placid and Collingswood. The yellow is Collingswood and the brown is Lake Placid. It is usually colder in Lake Placid.
|
Evelyn"I thought it was fun doing the graphs. I learned how to make graphs on the computer!"
|
MINUTES READ PER NIGHTThis graph compares the amount of minutes that I, Evelyn read with how many minutes Micah read from January 5 to January 23. This graph shows that Micah usually read more.
This bar graph shows how many minutes I read from 2/17 to 3/11. I read a similar amount each day! This shows that I usually read 30 minutes.
This line graph shows how many minutes I read from January into February! This shows that I read a bunch of different amount of times.
|